The following is a brief summary of the data processing protocols used for the experiments detailed here. By default, the peak selection is carried out by the agile2 integrator, however, where there were multiple peaks within the integration window, Spectrum Summation was used, which allows the user to manually select integration bounds. This website contains annotated chromatograms for all lipid species, and can be used as guidance to determine the appropriate peak to integrate in cases of closely eluting isomers/isobars. An example of this annotation can be seen here. Where a single MRM transition has multiple peaks to be integrated, the transition can be duplicated and renamed in the method editor to allow for separate integration.
After application of the Method File to the Batch File, the Compounds-at-a-Glance function can be used to visually inspect a selection of samples and confirm the correct integration bounds have been selected. For larger batches where retention times may shift due to column performance or solvent differences, Spectrum Summation will fail, as the integration bounds are fixed. See Figure 5 as an example of this issue. This can be overcome by using Time Referencing, which automatically moves the defined integration bounds used for Spectrum Summation for each MRM according to specified reference peaks, as can be seen below.
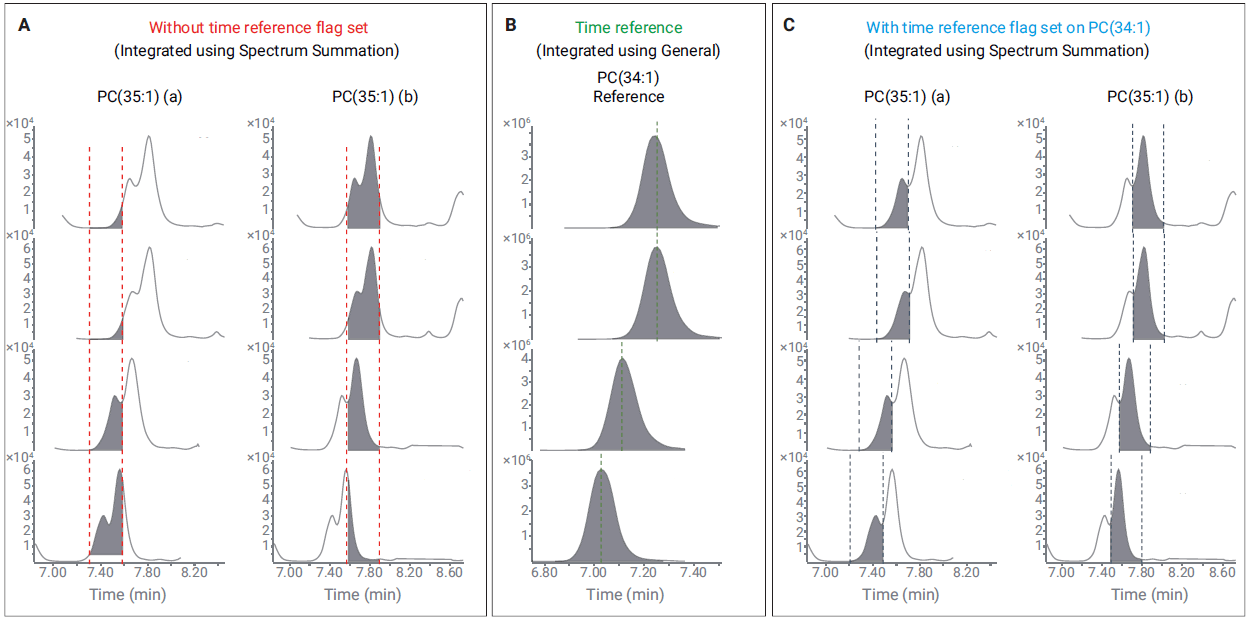
Use of time reference compounds to align difficult-to-integrate peaks. (A) Two isomers of PC(35:1) are integrated separately, but retention time drift results in poor integration using spectrum summation. (B) PC(34:1) is a good reference compound, owing to its high abundance and clean, symmetrical peak. (C) Integration of PC(35:1) after enabling time references and using PC(34:1) as the reference compound to correct for retention time drift.
We have identified appropriate time reference compounds for all lipid species. These are displayed below, with a csv version available for download.
| Lipid name | Transition | Time reference compound | ISTD compound | Response factor | Coefficient of variation1 | % background2 |
|---|
1%CV calculated for each lipid species concentration from 50 sequentially injected TQCs
2% background is median blank concentration as a percentage of the average NIST 1950 concentration within the same LCMS batch
